Confirm the property being assessed
The report resolves the address, whole-property lot set, local government area, coordinates and mapped parcel context before interpreting regional data.
Worked example · Clayfield QLD · sample dated 3 September 2026
This walkthrough uses the current 14-page sample report to show what the desktop evidence says, what it changes in early-stage thinking, and what still needs to be confirmed on site.
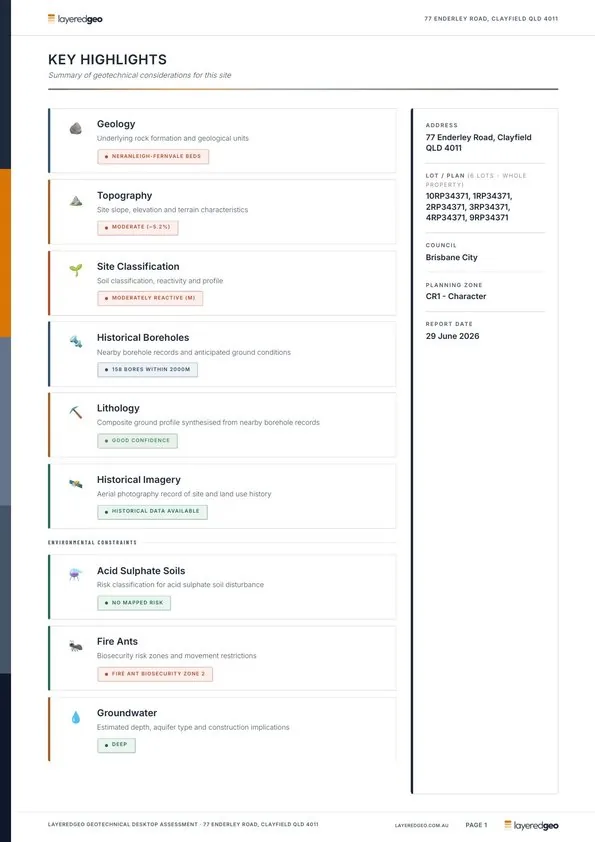
Before drilling and design, what does existing government mapping and nearby borehole evidence suggest about the site's terrain, likely ground profile and constraints - and where should a site-specific investigation focus?
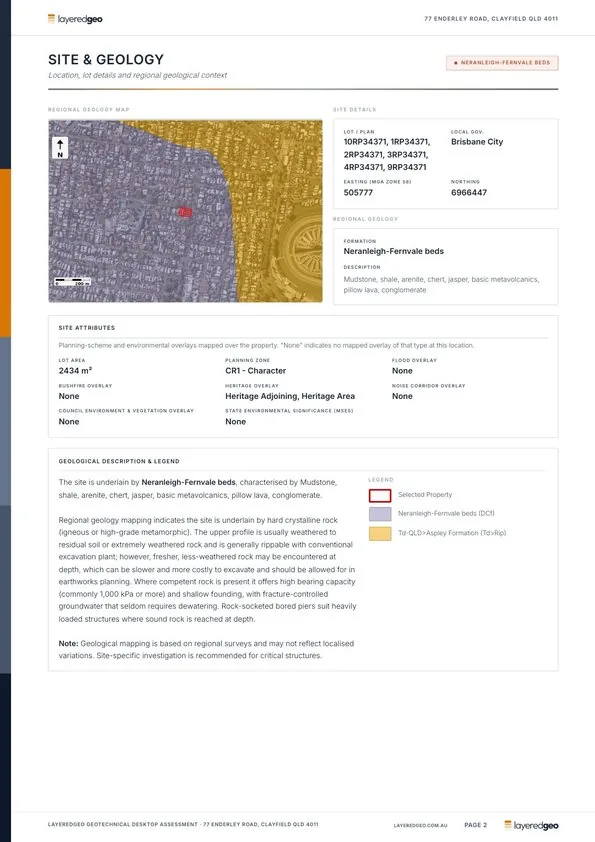
The mapped starting point
The parcel resolves to two lots in Clayfield and regional mapping places it on the Neranleigh-Fernvale beds: mudstone, shale, arenite, chert, jasper, metavolcanics, pillow lava and conglomerate.
These values are transcribed from the sample PDF. They are evidence for scoping and review, not field observations.
| Evidence area | Sample result | How it informs the next step |
|---|---|---|
| Terrain | Moderate 41.6-44.2 m AHD, 2.6 m total fall and approximately 9.0% average slope | Prompts early review of drainage, cut/fill, retaining and survey requirements. |
| Reactive soil screening | Variable potential Regional screen from mapped material and soil evidence, with an indicative AS 2870 movement range of S to M | Frames the shrink-swell question for investigation; it is a regional screen, not a site classification, which needs site testing. |
| Historical boreholes | 149 within 2 km The nearest bore used in the profile is reported 23 m from the site | Shows the density and proximity of historical evidence available to frame drilling expectations. |
| Composite lithology | Good confidence 64 bores combined, 75% average material agreement: clay 0.0-10.0 m | Creates an anticipated profile against which site boreholes can be planned and compared. |
| Groundwater | Deep estimate About 23 m, based on nearby groundwater records | Helps frame a dewatering question, but does not establish the groundwater level at the property or through time. |
| Environmental context | No mapped ASS risk Fire ant biosecurity zone 2 also identified | Records mapped screening results and a biosecurity constraint to check before soil movement. |
The report resolves the address, whole-property lot set, local government area, coordinates and mapped parcel context before interpreting regional data.
Geology, soil mapping, terrain and historical boreholes are brought together into a testable expectation rather than treated as isolated maps.
The moderate slope, reactive-soil screen, possible rock profile and borehole consensus help focus drilling depth, sampling, laboratory testing, groundwater observation and survey needs.
The engineer compares field logs and test results with the preliminary model, resolves differences and develops the project-specific classification and design advice.
Enter a QLD, NSW, VIC or SA address and generate the same report structure for the property you are reviewing.
Check an address →