QLD, NSW, VIC, SA, TAS & ACT · Zoning · Flood · Bushfire · Heritage
The Property Report:
planning, flood and terrain for any address
Enter a supported Queensland, NSW, Victorian, South Australian, Tasmanian or ACT address and see every planning constraint in seconds - zoning, flood risk, bushfire hazard, heritage, noise corridors, vegetation and environmental overlays, plus water, sewer and stormwater with recorded pipe depths. Free interactive preview. $9 for the property report; add the terrain section or the flood model section for $9 each.
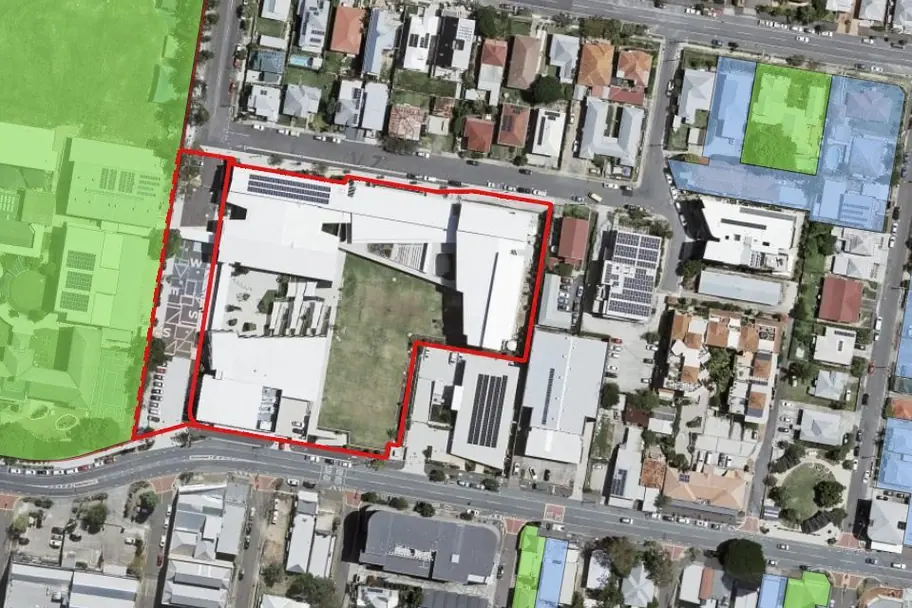 Heritage
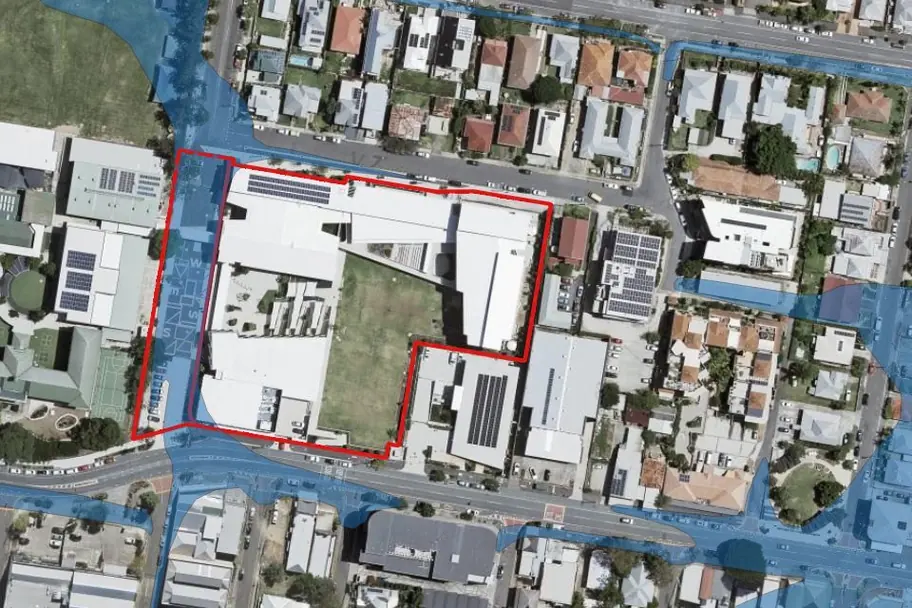 Flood
Flood
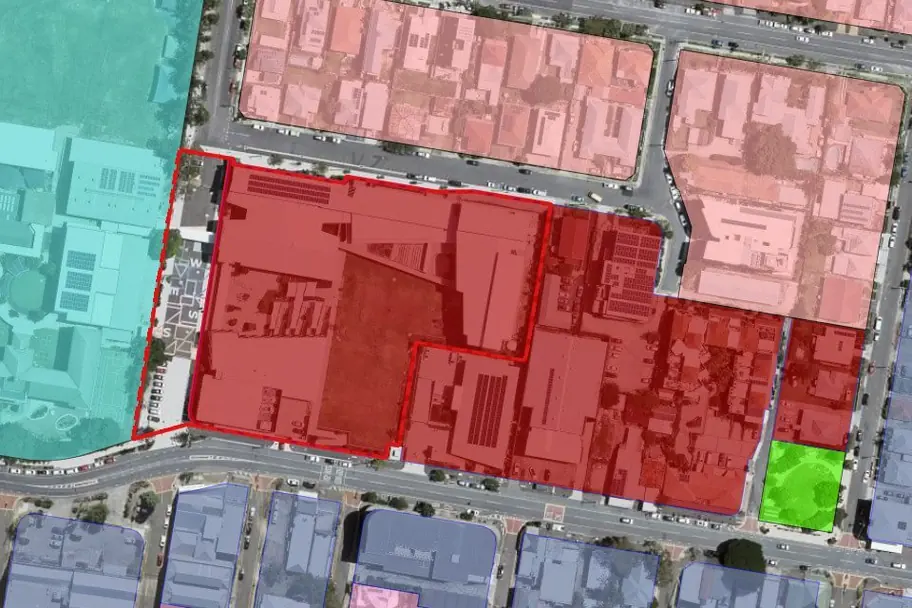 Zoning
Twelve sections in one report
All data is sourced from government-published spatial datasets for QLD, NSW, VIC, SA, TAS and ACT.
Planning Zone
Zone classification under the local planning scheme - the primary determinant of permitted land uses and development assessment pathways.
Flood Risk
Flood risk mapping, overland flow paths, coastal inundation, storm tide and recorded historic flood extents. AEP categories and floor level implications. Read from 491 flood maps and studies from 130+ councils and agencies.
Utilities and Pipe Depths
Water, sewer, stormwater and power mapped around the lot, with the recorded depth or invert level of the nearest sewer and stormwater mains where the utility publishes it.
Ground Hazards
Landslide and steep land mapping, mine subsidence districts and abandoned mine workings, acid sulfate soils and erosion prone areas, where the council or state maps them.
Bushfire Hazard
Bushfire-prone land mapping with hazard category (Very High, High, Medium). BAL construction standard implications for new buildings.
Heritage
Local heritage areas, character areas, State Heritage Register listings and SHR curtilage polygons. Development consent implications.
Noise Corridors
Transport noise corridors for road and rail infrastructure. Noise attenuation requirements for new residential development.
Aircraft Overflight
Where aircraft have been seen flying over the address: how often, how low and at what heights, from months of recorded aircraft positions. Kept separate from the ANEF noise contours, which are the planning control. Watched over every capital city and most regional centres; elsewhere the report says it was not assessed rather than reading clear.
Vegetation
Significant native vegetation, waterway and wetland vegetation, urban tree canopy and council vegetation protection overlays.
Environment
Biodiversity areas, koala habitat, ecological corridors, MSES and MLES overlays. Environmental assessment trigger identification.
Public Transport
Distance to nearest bus stop, railway station and ferry terminal. Context for density assessments and transport-oriented development.
Development Applications
DAs lodged on the lot, on adjoining lots and within 250 m over the last three years, drawn on the aerial with status and description. Sourced from the council and state registers we hold: Brisbane, Gold Coast, Sunshine Coast, Moreton Bay and Townsville in QLD, the NSW Planning Portal data state-wide, PlanSA, ACT DA Finder and City of Casey.
How it works
Enter your address
Type any Queensland, NSW, Victorian, South Australian, Tasmanian or ACT street address. The autocomplete finds it instantly.
Preview overlays
An interactive map loads instantly with coloured overlay polygons and a plain-language summary - free, no account needed.
Get the PDF report
Check out securely for $9 and the PDF property report - every overlay, its data source and methodology notes - is emailed to you in minutes.
Simple pricing
The map preview is always free. Pay only when you generate a PDF report.
Explore planning constraints by suburb
See how flood, bushfire, heritage and zoning overlays fall across Queensland, NSW, Victoria, South Australia, Tasmania and the ACT - a free planning profile and schematic for every suburb.
Browse QLD suburbs → Browse NSW suburbs → Browse VIC suburbs → Browse SA suburbs → Browse TAS suburbs → Browse ACT suburbs →Ready to check your site?
Enter a supported QLD, NSW, VIC, SA, TAS or ACT address and see every planning constraint in seconds.