Terrain Report · $9 · PDF in minutes
Which way does the block fall, and by how much?
The fall of the land decides the driveway, the slab, the retaining walls and where the water goes - and a listing photo flattens all of it. This report reads the state elevation model across one property and hands you the contour map, four cross sections with the grade on each, a slope map showing where the block is steep and which way it faces, and a 3D model of it in its landform. Check the address free, then decide.
Free: whether the report can be built for this address, and which of the three LayeredGeo reports it can get. No payment, no account.
- Address check is free
- No account needed
- Ready in minutes
- Automatic refund if it cannot be built
The numbers a sloping block hides
A photo cannot show half a metre of fall, and half a metre of fall is a retaining wall. These are the values the report reads off the elevation model for the lot itself, not the street.
High point
44.2 m AHD
The highest ground on the lot, in the same datum a surveyor and a flood study use, so it can sit beside a flood level or a floor level directly.
Low point
41.6 m AHD
The lowest ground - where the water finishes up, where the cut ends and the fill starts, and usually where the drainage has to go.
Total fall
2.6 m
Highest to lowest across the lot, with the direction it falls stated in words. The single number that separates a flat slab from a split level.
Average grade
9.0 %
The slope class of the block, plus the peak grade along each of the four cross sections - because an average can hide one steep corner.
Real values from the sample report below, for a Clayfield property in Brisbane. Every report states the same figures for its own lot, reads them from the state digital elevation model, and shows where they came from on the contour map and the four cross sections.
Read the whole report before you buy
Every page of a real Terrain Report, generated for a Brisbane property. Click any page to enlarge it, or download the PDF.
Want the sample in your inbox?
We'll email you the sample terrain report so you can read it later or forward it to a client. No spam, no account needed.
What every report does
The same four figures and the same honesty for any covered address, from a flat suburban lot to an acreage on a ridge.
A contour map of the block
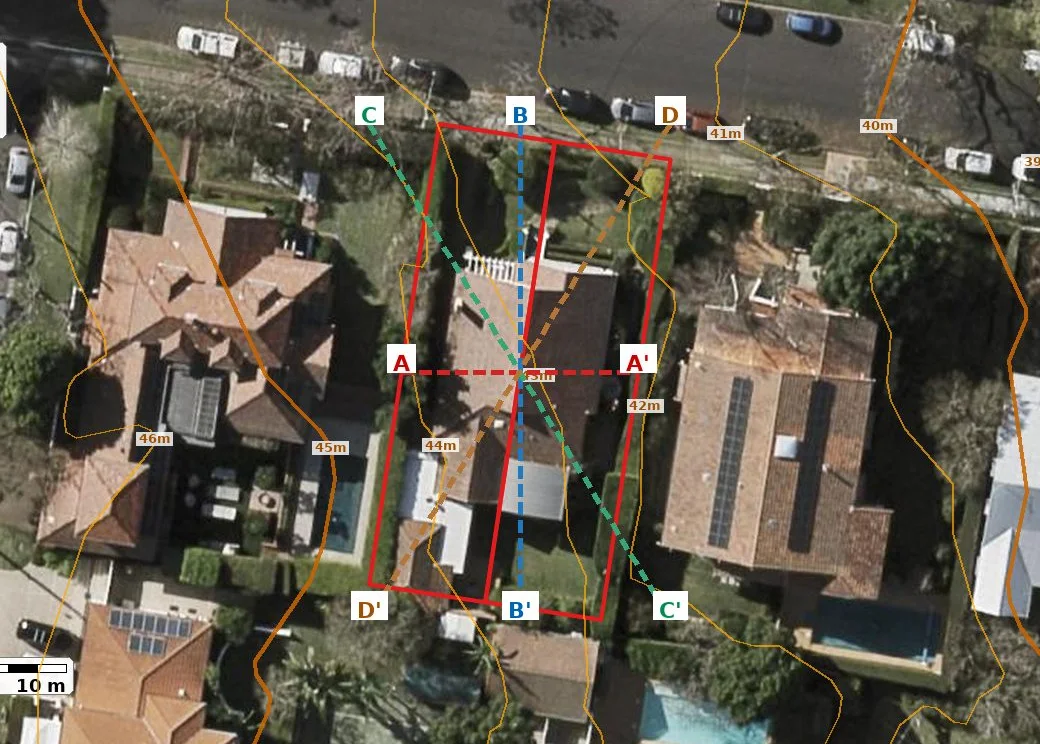
Contours over current aerial imagery with the parcel boundary drawn on and the four transect lines marked, so every number in the report can be pointed at on the map.
Four cross sections
W-E, N-S and both diagonals, each drawn to scale with the parcel marked on the profile and the peak grade inside the boundary stated as a percentage.
The driveway grade
A profile from the middle of the street frontage in to the centre of the lot, with the average grade over that run and the steepest 5 m in it, printed beside the driveway grades published in AS/NZS 2890.1. The first practical question on a sloping block, answered with the existing ground.
A profile along every boundary
One chart per side of the property, run along the cadastral line itself with a key plan showing which side is which - the levels a fence, a retaining wall or a boundary drain has to work with, and where a neighbour's ground sits against yours.
A slope map, not just an average
Every part of the block classed flat, gentle, moderate or steep, with the share of the lot in each - so one steep band across an otherwise flat block shows up instead of averaging away.
The aspect of the block
The compass direction the ground falls toward, measured across the whole lot: which boundary is the high side, and whether the slope faces the sun or away from it.
A 3D model of the landform
Aerial imagery draped over the elevation model for 200 m around the lot, with the boundary outlined - the hill the block sits on, the gully beside it, the fall of the street.
Which way the water goes
The high and low points in metres AHD, the total fall between them, and where the block sits against the surrounding 200 m - the shape runoff and drainage will follow.
Honest about what it is
Every figure names the state elevation model it was read from, and the report says plainly that it describes the surface only - no soil, rock or groundwater claims.
Minutes, not weeks
Built on demand and emailed as a PDF you can forward. If the map or the cross sections cannot be produced, nothing thinner is delivered - the payment is refunded.
Where it sits beside a survey
This is the screening step, not the survey. It is what tells you whether the block needs a surveyor's numbers before you commit, and what to ask for when it does.
| Comparison | Terrain Report | Detail & contour survey | Listing photos & free maps |
|---|---|---|---|
| What you get | Contour map, four cross sections with grades, slope map with aspect, 3D landform model, fall and slope figures for the lot | Surveyed levels, features and boundaries certified by a licensed surveyor | A photo that flattens the slope, or coarse contours with no boundary and no numbers for the lot |
| Basis | The state digital elevation model, read across the parcel and named on every figure | Instruments on the ground - the authoritative record | Varies, and rarely stated |
| Cost and wait | $9, minutes, no account, no site access needed | Typically $1,000 or more and days to weeks, and you need access to the site | Free |
| Use it for | Deciding whether to buy, an early quote, and whether the survey is worth ordering yet | Design, drainage, construction set-out and anything lodged with council | A first impression, at your own risk |
The council's planning controls on the lot - zoning, the flood overlay, bushfire, heritage, easements - are the planning report, also $9. The modelled flood depth in metres is the Flood Model Report, also $9. The ground beneath the surface - geology, soils, reactive-soil screening, bore logs, groundwater - is the geotechnical desktop report. Terrain is also sold as a section of the Property Report - $18 with planning, $25 with the flood model where one is held.
Who reads this before they commit
Buyers
A sloping block found after the contract is signed is a retaining wall, a split slab or a cut-and-fill bill. See the fall, the grade and the landform for every property on the shortlist, without driving to any of them.
Builders and designers
A number on the grade before the quote goes in, and the cross sections to sketch a driveway or a slab against - in time for the tender, not after the surveyor's invoice.
Owners planning works
A shed, a pool, a granny flat or a retaining wall all start with the same question: how much does this part of the yard actually fall? The cross sections answer it per direction.
Engineers and drafters
The same elevation data as data: 0.5 m or 1.0 m contours, the DEM and a TIN in DXF, GeoPackage, Shapefile or KMZ. Order it through GIS Export →
Questions
See the shape of the block
The address check is free and takes a few seconds. The report follows in minutes.
Built from each state's published digital elevation model, read across the cadastral parcel. Every figure describes the shape of the ground surface as most recently captured, with no interpretation of the soil, rock or groundwater beneath it. This is a screening report: it is not a survey, boundaries shown are cadastral mapping rather than a boundary survey, levels are model values rather than surveyed levels, and it does not replace a licensed surveyor or engineering advice for design, drainage or construction. Need the elevation as data - contours, DEM and TIN in DXF, GeoPackage, Shapefile or KMZ? See Contours & Elevation in GIS Export.