Flood Model Report · $9 · PDF in minutes
How deep does the water get on this block?
Councils model flood depth street by street, then publish the grids and almost none of the answers. This report reads every published model that reaches the property and states the modelled depth, velocity and flood level in metres AHD for every event, with a map of each. Check the address free, then decide.
Free: how many studies and modelled events reach the property, and whether any of them put water on it. No numbers, no payment, no account.
- Coverage check is free
- No account needed
- Ready in minutes
- Automatic refund if it cannot be built
Four numbers, for every event the council modelled
A flood map coloured blue tells you there is water. These are the values the model actually holds at your boundary, read from the publisher's grid and quoted with the event and climate scenario they belong to.
Max depth
3.35 m
How deep the water stands on the property at the deepest modelled moment of the event. The number that decides whether a flood is a wet yard or a wet house.
Max velocity
1.72 m/s
How fast it moves. Above about 1 m/s water becomes hard to stand in, and it starts to matter for fences, cars, driveways and where you would walk out.
Depth x velocity
5.73 m²/s
The product used in Australian flood hazard guidance. Quoted as the publisher's own value; no hazard class is invented here that they did not publish.
Flood level
11.49 m AHD
The water surface height in the same datum a surveyor uses, so it can be compared directly with a surveyed floor level or a proposed one.
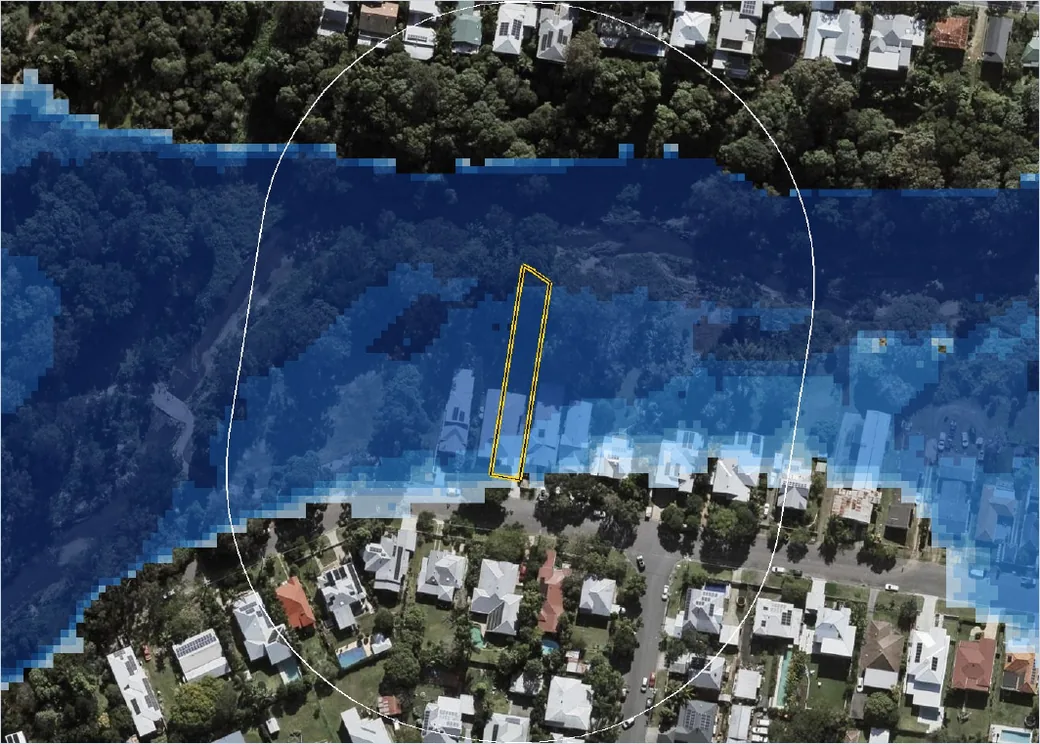
Real values from the sample report below, for the 100-year ARI event of the Breakfast Creek study. That property carries 27 modelled events across 5 studies, and the report tables every one of them, present day and future climate, then maps each event that reaches the block.
Read the whole report before you buy
All 17 pages of a real Flood Model Report, generated for a Brisbane property on Breakfast Creek. Click any page to enlarge it, or download the PDF.
Want the sample in your inbox?
We'll email you the sample flood model report so you can read it later or forward it to a client. No spam, no account needed.
What every report does
The same six things for any covered address, whether the council publishes a property report of its own or nothing at all, and a sea level rise page where the address is on the coast.
Every modelled event
From the frequent 2-year storm to the 2000-year and PMF-scale events, present day and future climate where the council modelled them. Not just the 1% AEP.
A map of each event
Modelled water over current aerial imagery with your boundary drawn on, so you can see which part of the block goes under and which part stays dry.
Honest about silence
"Assessed and dry" is told apart from "not modelled here". Water that stops short of the boundary is reported with its distance, and anything within 50 m counts.
Recorded floods too
The mapped extents of real events, 1974, 2011, 2022 and others where the council or state publishes them, checked against your boundary and drawn on one map.
Sources named
Every finding carries the study, the publisher and the licence behind it, so a builder, an insurer or a council officer can trace the number back to its grid.
Minutes, not weeks
Built on demand from grids already held, delivered as a PDF you can forward. If it cannot be generated, the payment is refunded automatically.
Sea level rise on the coast
For coastal addresses, the IPCC AR6 projection at the nearest tide gauge for 2050 and 2100 under three emissions scenarios, with the gauge named and its distance stated. How to read it.
Where it sits beside the council's answers
This is the screening step, not the certificate. It is what tells you whether the certificate is worth ordering, and what to ask when you do.
| Comparison | Flood Model Report | Council flood certificate | Planning scheme flood overlay |
|---|---|---|---|
| What you get | Modelled depth, velocity, depth x velocity and flood level for every published event, plus a map of each and the recorded flood extents | The council's adopted flood level for the property, as a formal document | A yes or no overlay polygon and the development controls that follow from it |
| Events covered | Every event the publisher modelled, present day and future climate | Usually the one adopted defined flood level | The single mapped planning event |
| Cost and wait | $9, minutes, no account | Typically $50 to $60 and several days to a fortnight, where the council offers one | Free, but only where the council maps it |
| Use it for | Deciding whether to buy, what to ask for and whether a certificate is worth ordering | Lodging a building or development application | Understanding what the council will assess |
Looking for the flood overlay itself, along with zoning, bushfire, heritage, easements and every other planning control on the lot? That is the planning report, also $9. The lie of the land - contours, cross sections and a 3D model - is the Terrain Report, also $9. The flood model is also sold as a section of the Property Report - $18 with planning, $25 with terrain too.
Who reads this before they sign
Buyers
A listing says "flood free" or says nothing. This says whether the block is wet in a 5-year storm or only in a 500-year one, and how deep, in time for the cooling-off period.
Owners and sellers
A written record of the modelled depth and level at your own boundary, with the study named, to put beside an insurer's or a valuer's flood rating, or in front of a buyer who asks.
Builders and designers
The flood level in metres AHD to compare with a surveyed floor level, and the velocity that comes with it, before a design or a slab level is settled.
Engineers and consultants
The same depth, velocity, hazard and level grids clipped to the property as GeoTIFF, with 0.5 m or 1.0 m contours in DXF, GeoPackage, Shapefile or KMZ. Order the grids through GIS Export →
Where the models come from
Every grid is published open data from the council or agency that modelled it. Coverage grows as publishers release studies, so this list is read from the holdings rather than written into the page.
Australian Capital Territory
1 study · 2 modelled runs
- ACT Government1 study · 2 runs
New South Wales
28 studies · 418 modelled runs
- City of Coffs Harbour5 studies · 92 runs
- Central Coast Council6 studies · 72 runs
- Albury City Council1 study · 49 runs
- NSW Reconstruction Authority2 studies · 45 runs
- Lake Macquarie City Council2 studies · 33 runs
- Inner West Council2 studies · 22 runs
- Camden Council1 study · 21 runs
- Dungog Shire Council1 study · 21 runs
- City of Newcastle1 study · 15 runs
- Hilltops Council1 study · 10 runs
- Lockhart Shire Council1 study · 8 runs
- Snowy Valleys Council1 study · 8 runs
- Wollongong City Council1 study · 8 runs
- Edward River Council1 study · 7 runs
- Fairfield City Council1 study · 5 runs
- Central Darling Shire Council1 study · 2 runs
Queensland
55 studies · 3,013 modelled runs
- Brisbane City Council53 studies · 2,921 runs
- Queensland Government (QSpatial) / GHD1 study · 84 runs
- City of Moreton Bay1 study · 8 runs
Tasmania
2 studies · 32 modelled runs
- Tasmania State Emergency Service (via the LIST)2 studies · 32 runs
A publisher appearing here means we hold its grids, not that every address in its area is modelled: flood studies cover catchments, not whole council areas. The free check above is the answer for one property, and it runs before any payment. Where nothing reaches the address the report is not offered at all, because an absence of modelling is not a finding that the property does not flood.
Questions
Find out what the modelling says
The coverage check is free and takes a few seconds. You only pay if a published model actually reaches the property.
Built from flood model grids that councils and state agencies publish as open data, listed above. Every value is the publisher's modelled figure for a design storm, read at the property boundary. This is a screening report from published modelling: it is not a site-specific flood study, a flood certificate, a record of past flooding or a forecast, and it does not replace advice from a suitably qualified flood or civil engineer. Recorded flood extents are mapped after the event and vary in accuracy and completeness; an absence of a recorded extent does not mean an area has never flooded. Need the grids themselves in GIS or CAD? See Modelled Flood Surfaces in GIS Export.